Claude in Google Workspace: How I Would Build a Monthly Report

The tedious part of a monthly report is often the trip from checked numbers to a document and then to slides. I would try Claude in Google Workspace on that job first. My starting point would be one small report whose numbers I can trace, rather than a presentation that looks impressive but takes longer to check.
I picked this up from Ledge.ai on October 8, 2026, then checked the October 6 announcement and official guide on October 11. Claude’s paid-plan beta lets users request reading and editing within Google Docs, Sheets and Slides. I would check availability and my organization’s app rules before using it.
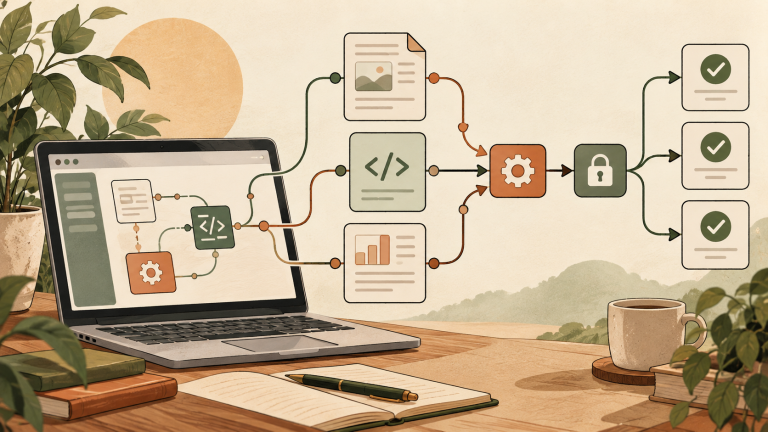
This is a workflow I would try, not a hands-on product test. The advertising data below is fictional. It represents no client’s results. The illustrations are AI generated and are not screenshots of Claude or evidence of an actual run.
One report, with a small definition of done
I would limit the first attempt to a calculation table, a one-page explanation and three slides. The useful question is whether I can make a sound decision with less total work. A polished deck is secondary.
I would work on copied data and agree on the period, currency, tax treatment and definition of a lead. Are repeat inquiries counted twice? Did tracking change during the month? Those details need an answer before an assistant starts explaining performance.

Equal click costs can hide very different lead costs
Here is an invented September example, in Japanese yen. CPC means spend divided by clicks. Cost per lead means spend divided by recorded inquiries.
| Campaign | Spend (JPY) | Clicks | Leads | CPC (JPY) | Cost per lead (JPY) |
|---|---|---|---|---|---|
| A | 36,000 | 900 | 18 | 40 | 2,000 |
| B | 20,000 | 500 | 5 | 40 | 4,000 |
Both campaigns buy clicks at the same cost. B costs twice as much per inquiry. I still would not write that B has bad creative: this table tells me nothing about landing-page behavior, lead quality or missing tracking events.
With campaign names in column A, spend in B, clicks in C and leads in D, I would use =IF(C2=0,"",B2/C2) for CPC and =IF(D2=0,"",B2/D2) for cost per lead. A campaign with zero leads should not appear to have a zero lead cost. I would leave that result blank and explain why.
The spreadsheet request I would start with
Use only the selected table. Calculate CPC and cost per lead for each campaign without changing the source values. Keep formulas and source cells traceable. If a denominator is zero, leave the result blank and add a reason. Do not invent missing values. Ask before proceeding if the period or lead definition is unclear.
I would check two rows myself before trusting the rest. The combined spend is JPY 56,000 and the combined lead count is 23, giving an overall cost per lead of about JPY 2,435. Averaging the two campaign-level costs would give JPY 3,000, which answers a different question. Catching that difference is a useful first test.
A report should say what remains unknown
Next, I would turn the checked table into a one-page document. My structure would be findings, evidence and next checks. I would remove inflated language and explanations that the data cannot support.
Write a monthly report that the owner can read in five minutes. Separate observed facts, possible explanations and next month’s checks. This table does not establish why B has a higher lead cost. Revenue, signed contracts and lead quality have not been provided. Do not add unsupported year-over-year figures, improvement percentages or claims of business success.
A sensible draft might say: A recorded 18 inquiries and B recorded five. B’s click cost matched A’s, but its lead cost was higher. Before changing budgets, check inquiry follow-up, page-level drop-off and tracking configuration. That is a usable decision path. It does not pretend that five leads tell us which campaign makes more money.
Three slides, reviewed one stage at a time
I would make slide one the current situation, slide two the campaign comparison and slide three the next checks. Each slide gets one point. More charts do not automatically make a meeting more useful.
Draft three slides from the checked report: the current situation, A versus B, and next month’s checks. Use one main claim per slide. Do not invent chart data. Leave a review note identifying the supporting table or cells. Keep inquiries distinct from contracts and revenue.
I would not assume that the in-file sidebar completes a three-app handoff. The sidebar and Claude’s separate connectors are different workflows. My first attempt would move through the files in stages, with edit approval enabled and Google version history available if I need to undo changes.
A side-income service needs a clear boundary
This could be useful for preparing a small business’s monthly report. I would describe the service as organizing supplied data and producing material for decisions. I would not promise that the assistant will improve advertising results or increase revenue.
Before accepting the work, I would agree on input format, file count, revision rounds, deadlines and the treatment of missing data. Client or personal information also needs the client’s permission and an appropriate working environment. If explaining the scope feels awkward, I would use the client-meeting rehearsal exercise before the call.

The six checks I would make before delivery
- The period, currency and tax treatment are consistent.
- Totals match source data and formulas remain traceable.
- Leads have not been relabeled as contracts or sales.
- Facts and hypotheses are separate, with no invented metrics.
- Slide text and charts are readable and agree with the report.
- Recipients, revisions and confidential information have been checked.
I would measure preparation, generation, review and revision together. If an instant draft takes longer to verify than my usual process, I would change what I ask the assistant to do. One month’s report is enough to identify a useful step without committing the whole workflow.
Sources: Ledge.ai, October 8, 2026; Claude announcement, October 6, 2026; official usage guide. Checked October 11, 2026.